Designing Zest's Wastemap to reveal hidden losses in food production
Zest's Wastemap turns fragmented factory data into a simple, visual picture of where food is lost and where edible surplus could have created value instead of being written off.
Seven times more food is wasted in factories than in supermarkets, and 70% of that waste is still perfectly edible – yet most manufacturers have no clear picture of where it happens or how much it really costs them.
Challenge
Food manufacturers are under pressure to cut waste and emissions, but often lack a clear view of where in production food is turning into waste and why. That makes it difficult to avoid losses early, and means they carry unnecessary cost, carbon and compliance risk.
Approach
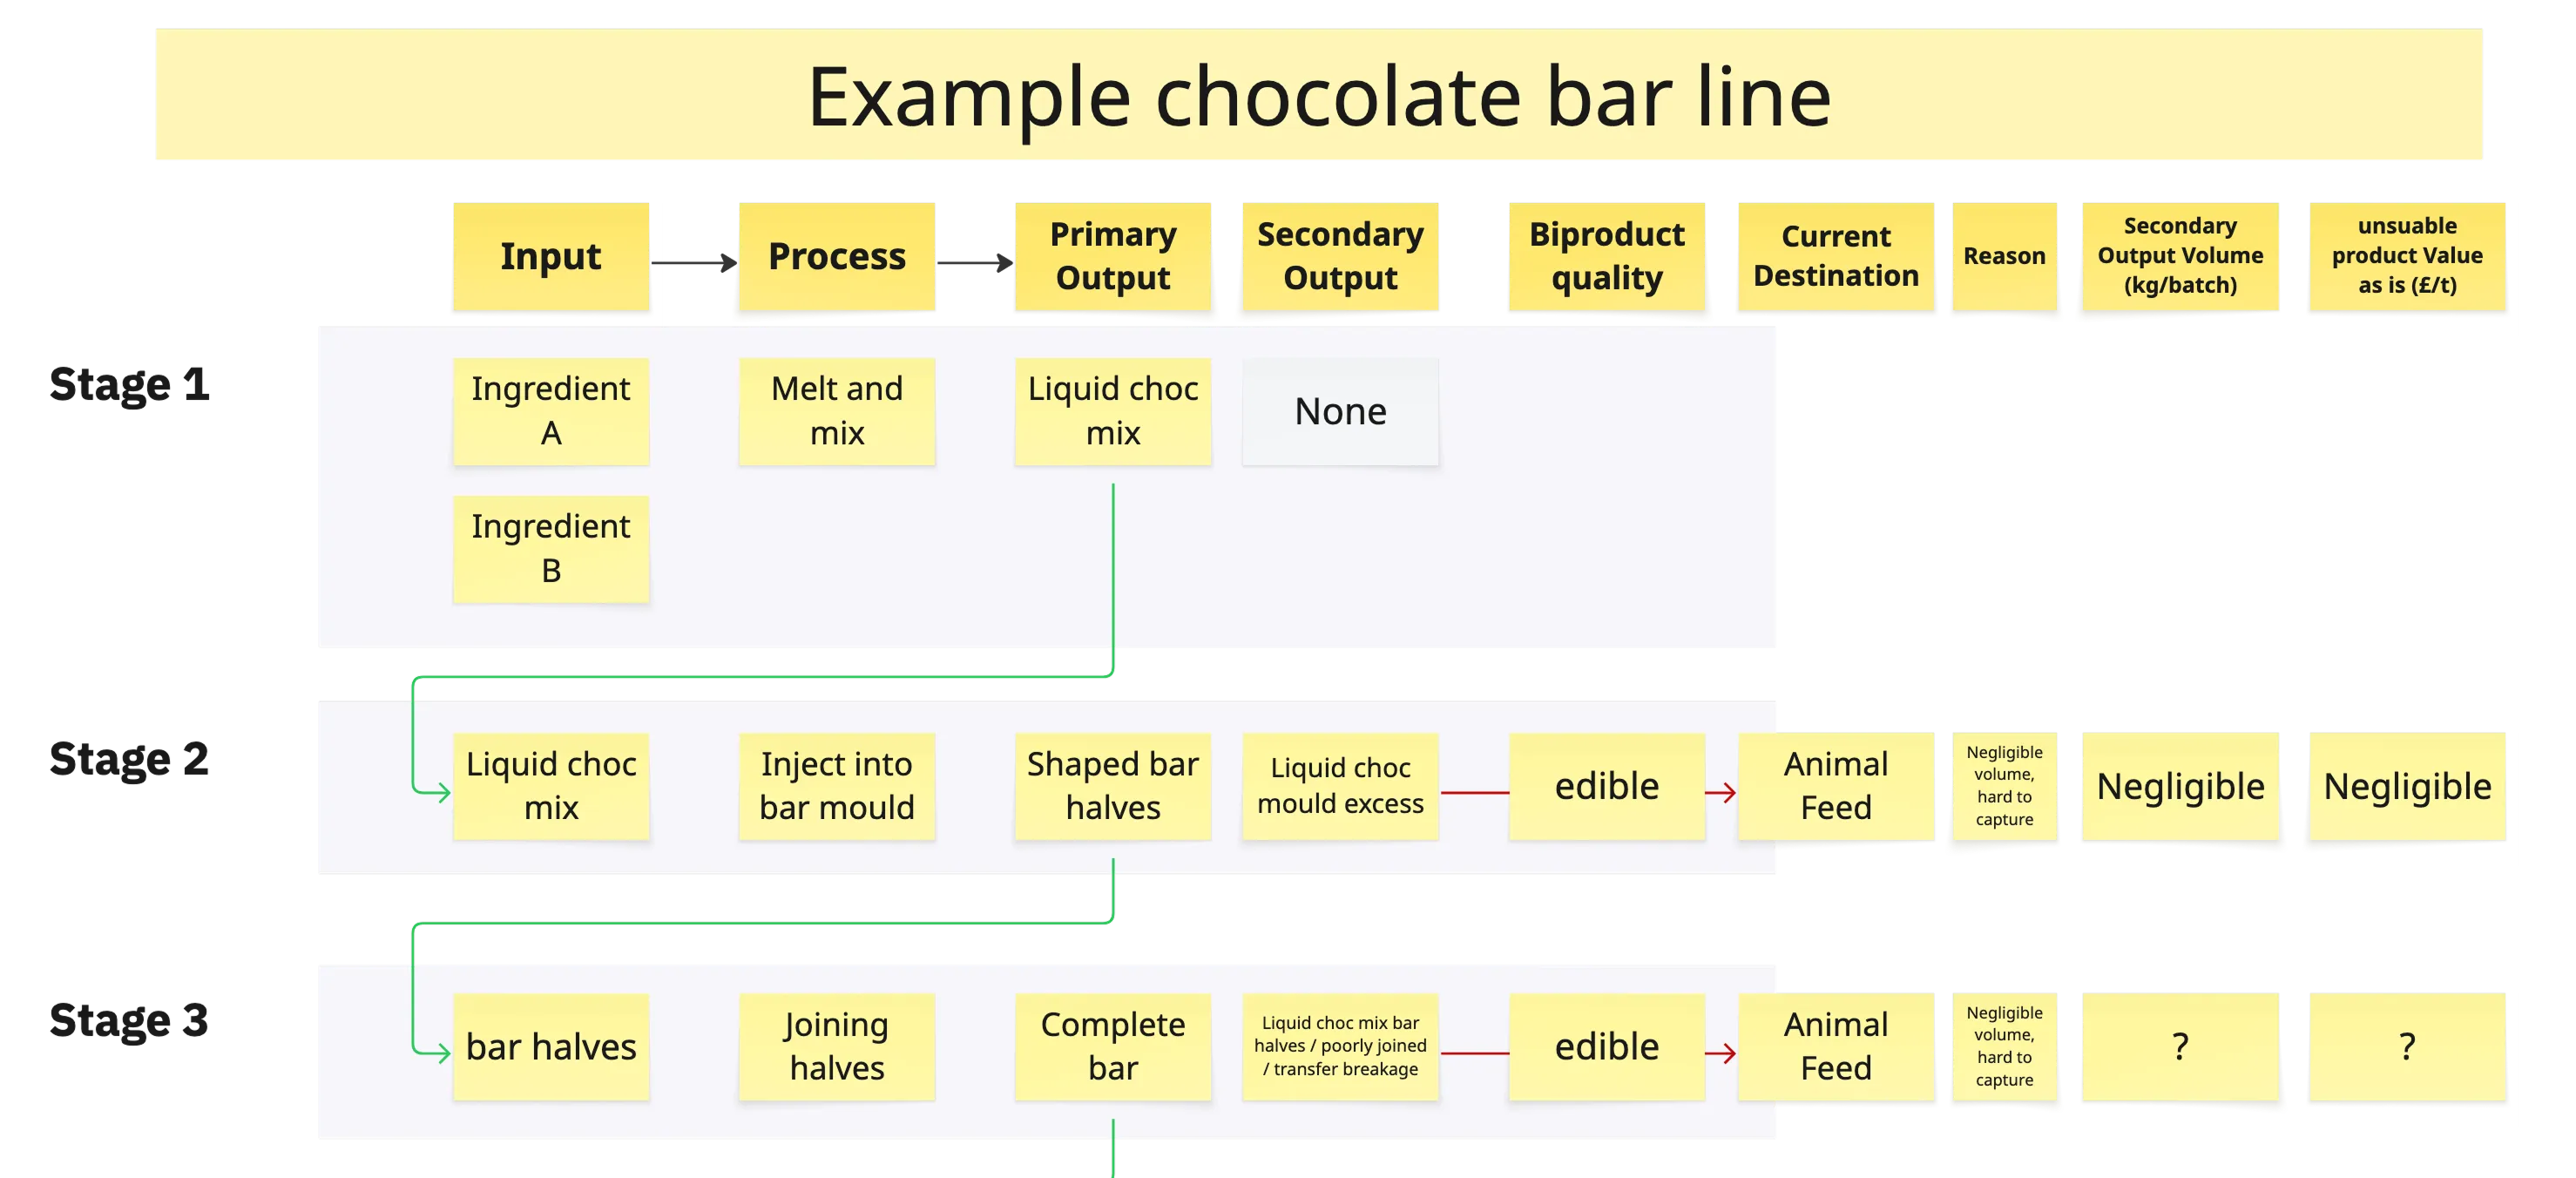
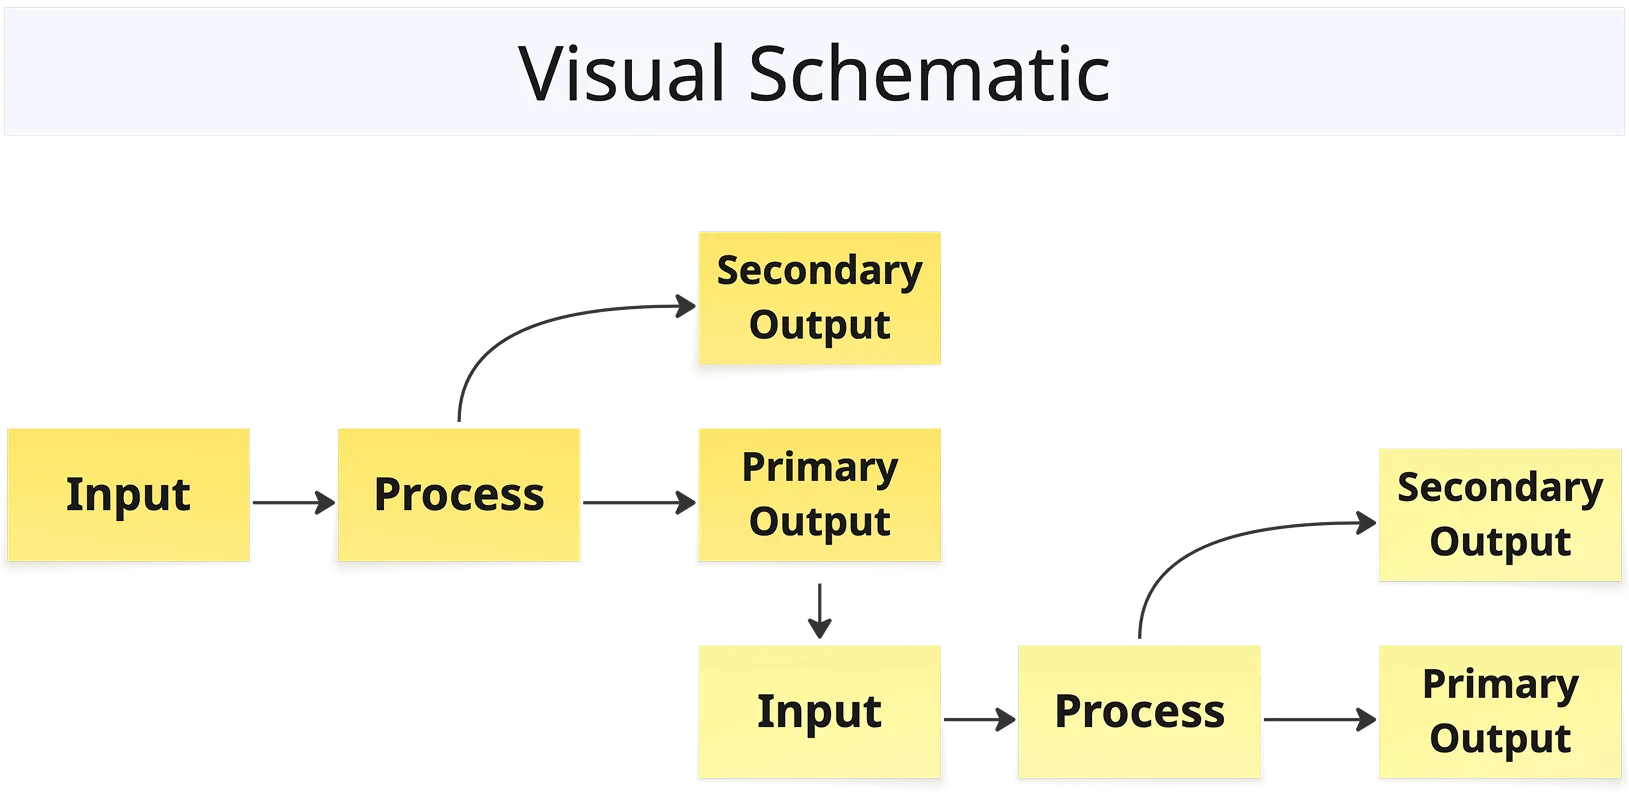
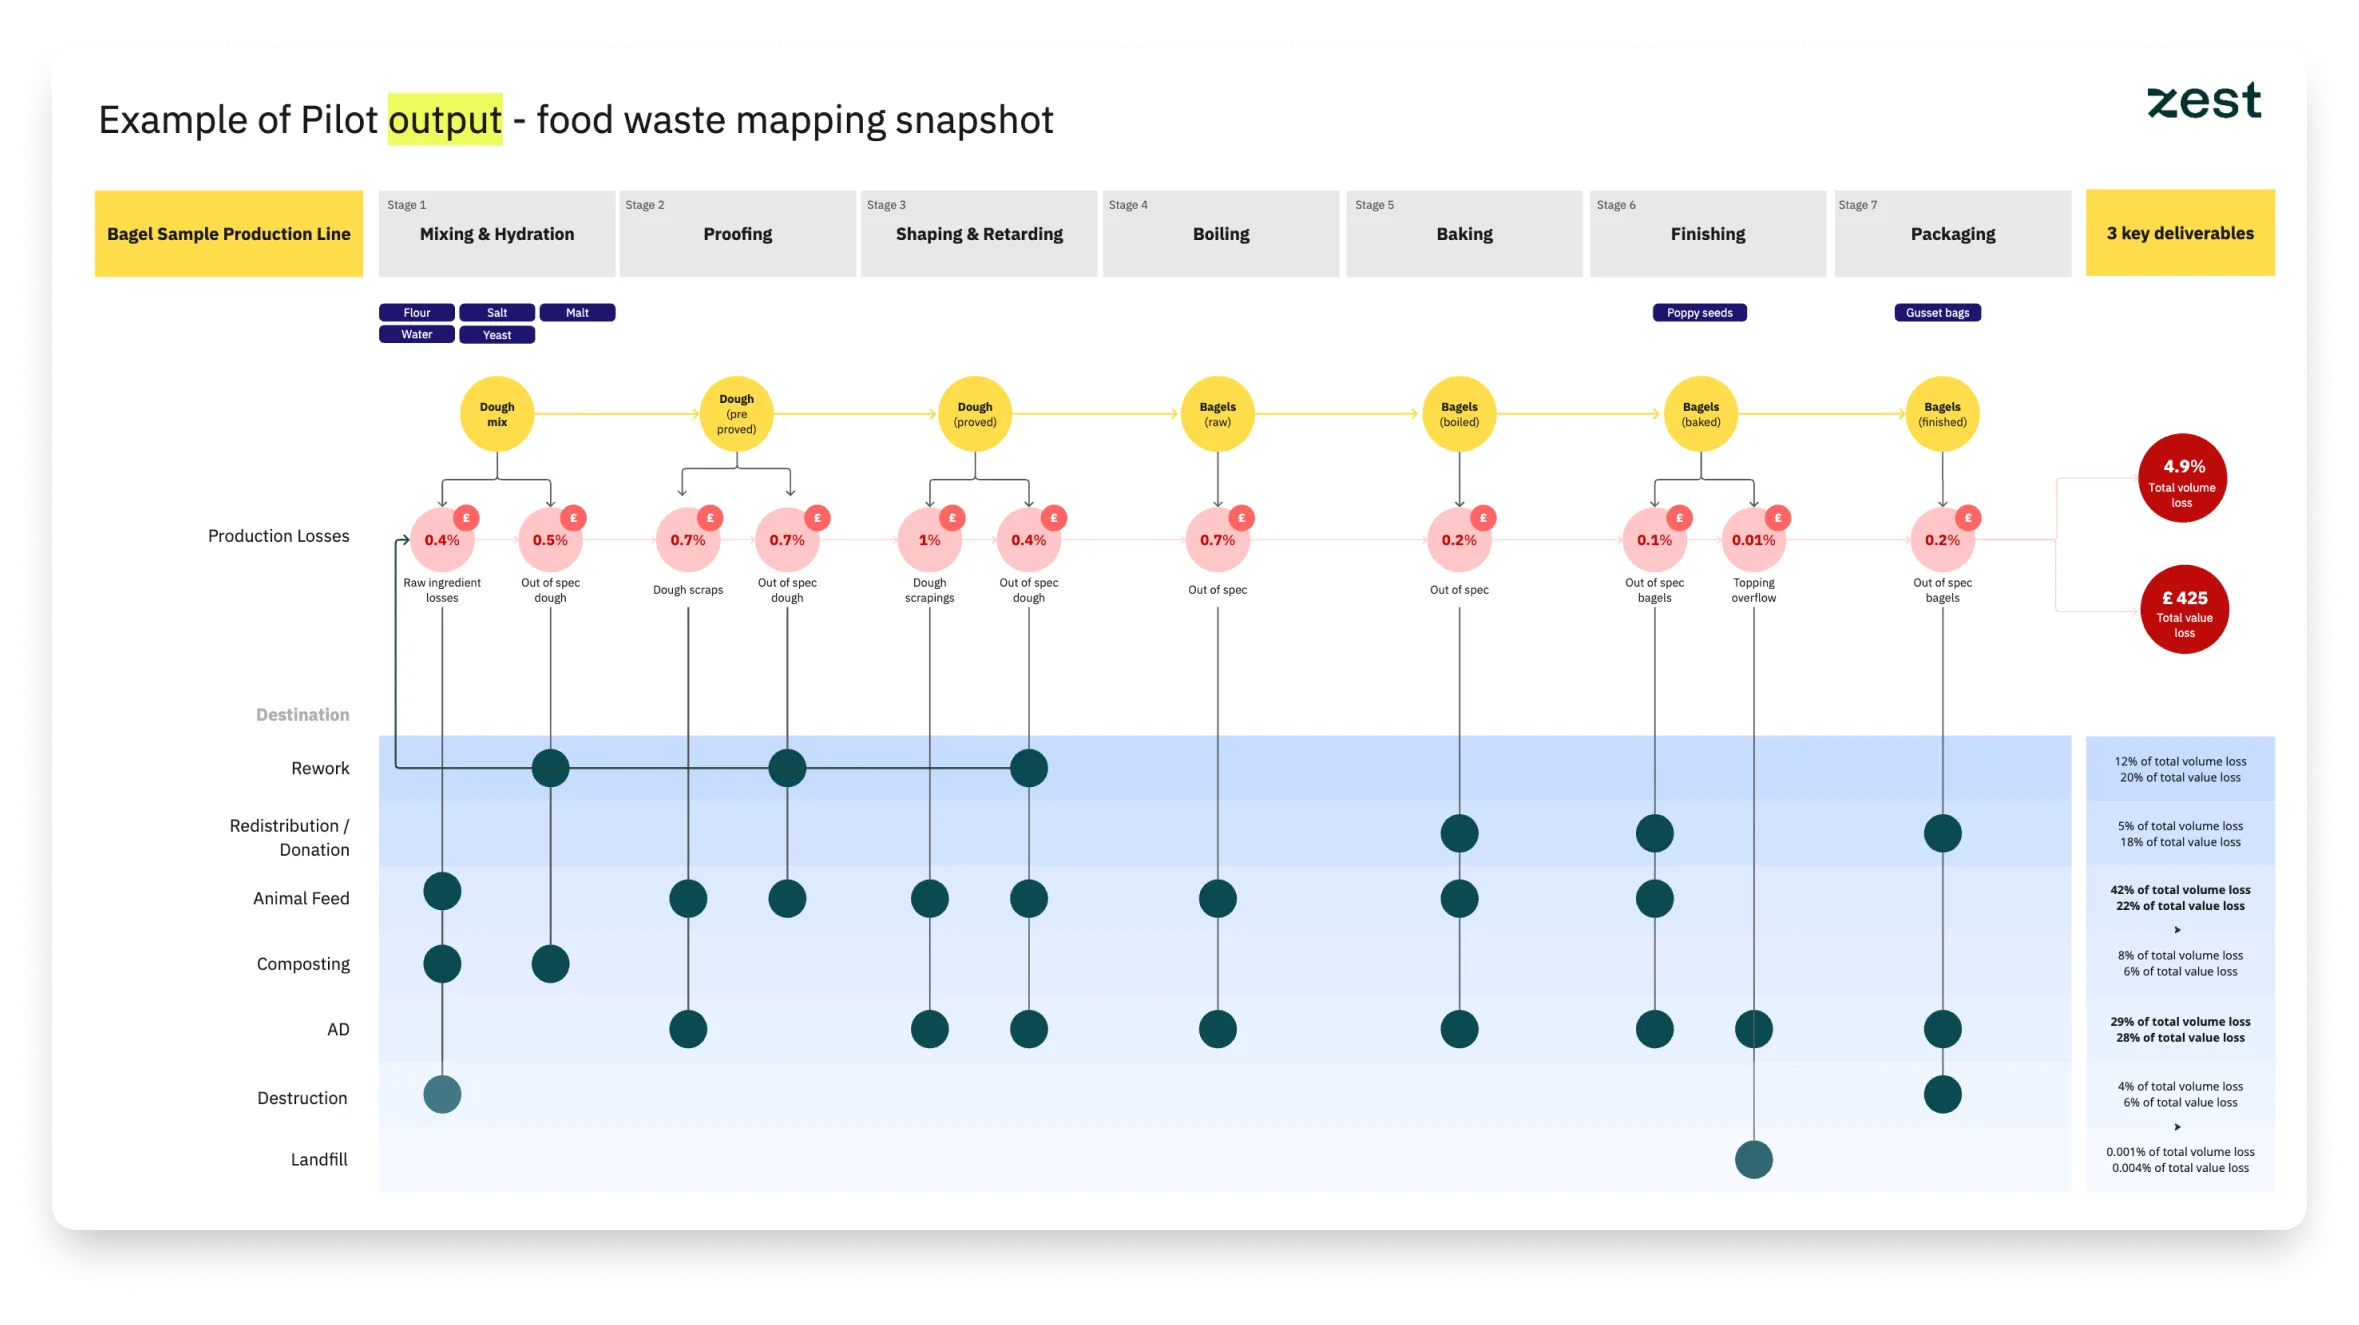
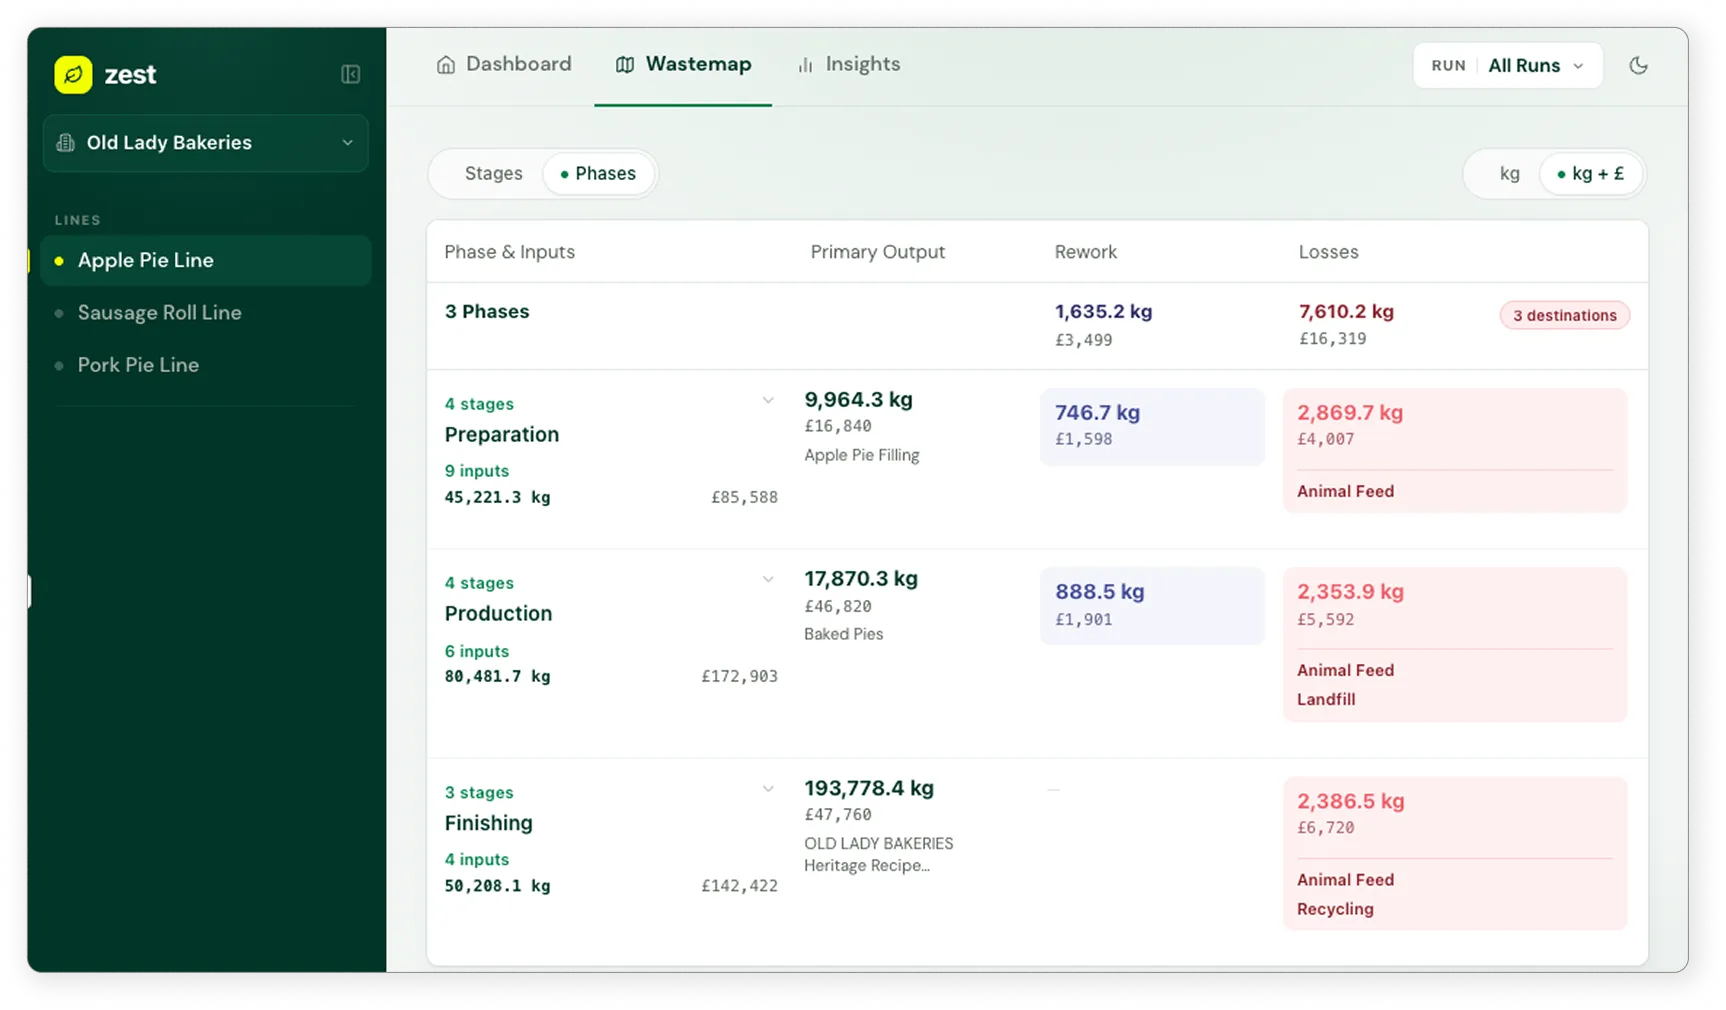
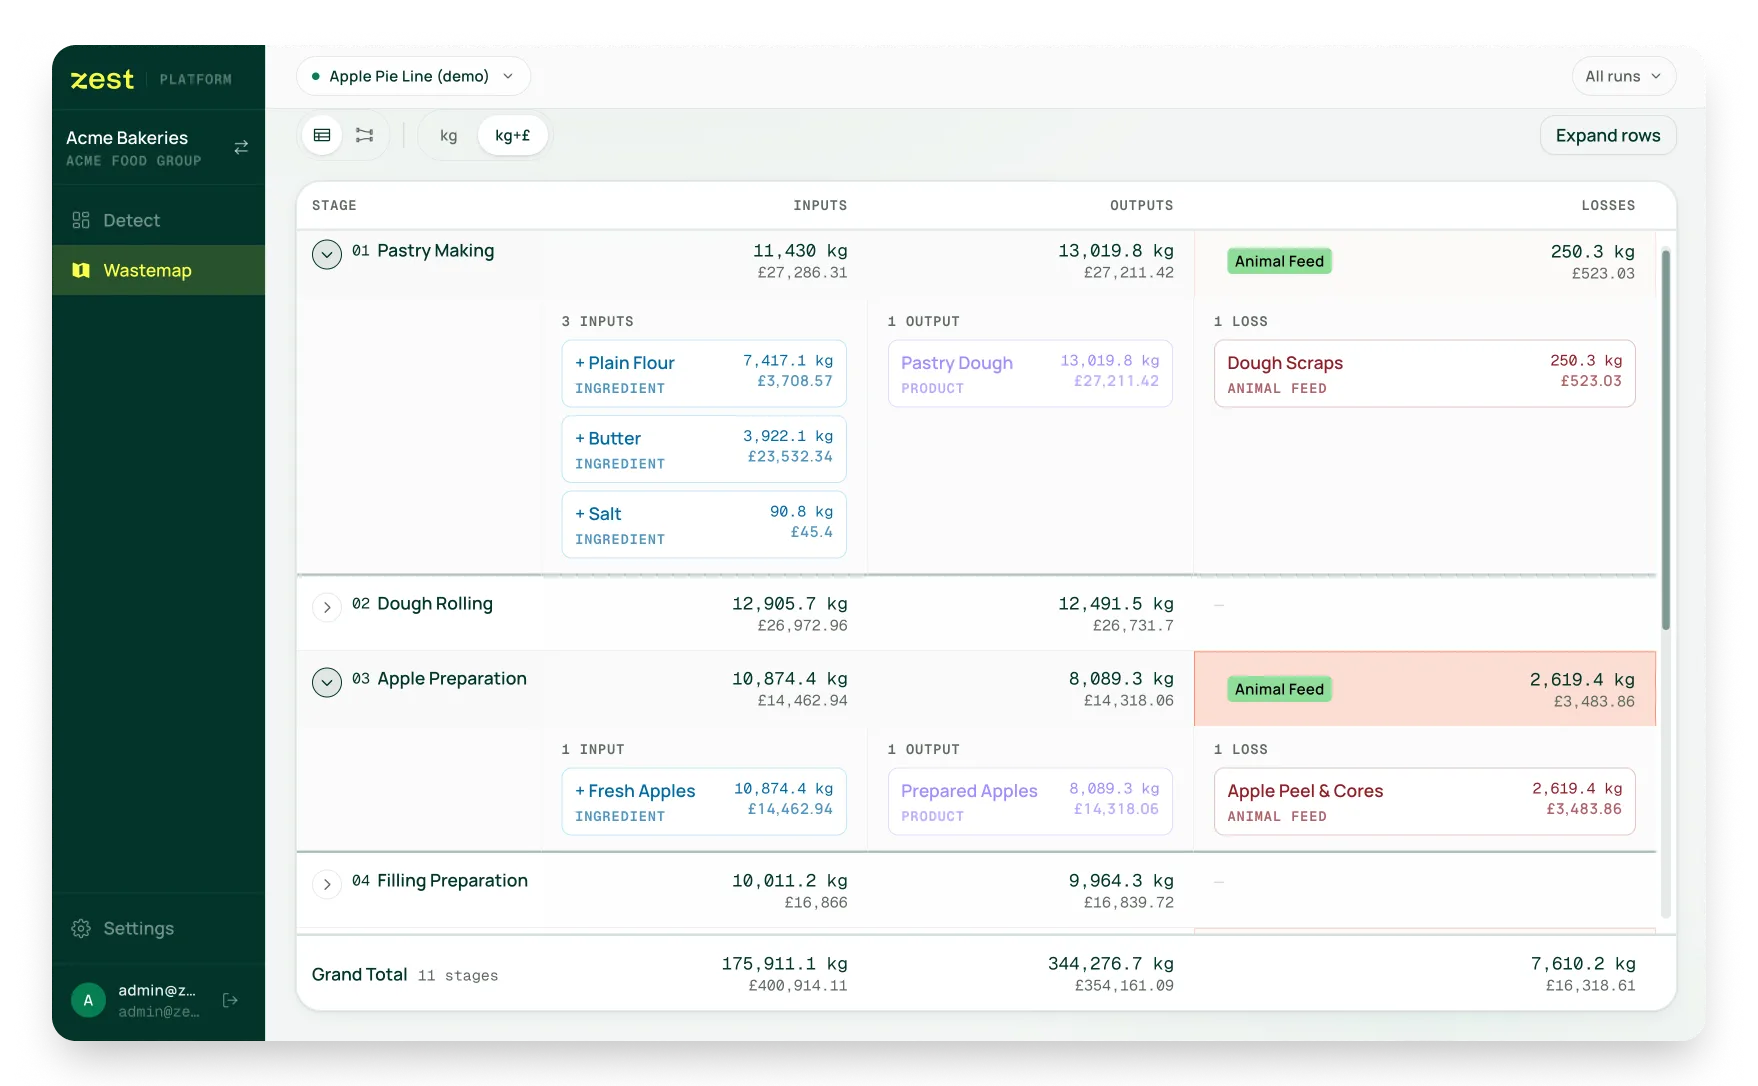
The waste map brings together data from across the factory into a stage‑by‑stage view of how food moves through production, where it is lost, and where it ends up.
Outcome
The waste map now gives manufacturers a shared, clear picture of their biggest waste hotspots and opportunities, becoming the natural starting point for reduction, redistribution, and wider optimisation work.
Context & Problem
The blind spot
Why waste in factories is so hard to see and deal with
Food manufacturers often treat most production losses the same, even when much of that “waste” is still perfectly edible. That hides both the true cost of waste and a huge opportunity to keep food in the human chain for longer.
How valuable surplus becomes low‑value waste
On most sites, anything that cannot be easily reworked back into production is effectively treated as inedible waste and moved off site, often at low value, for example as animal feed. Factory incentives, entrenched processes and fragmented data make it hard to keep more of those losses edible, even when everyone agrees that waste is a serious problem.
The scale of the opportunity
At the same time, this blind spot is a major opportunity. When Zest analysed individual production lines in detail, they repeatedly found interventions that could avoid thousands of tonnes of waste per year or save up to seven figures annually on a single line. With tighter regulation, rising ingredient costs and growing demand for food donations, this became the right moment to act – and Zest set out to build a solution that could turn hidden waste into real value.
Approach & Process
The design challenge
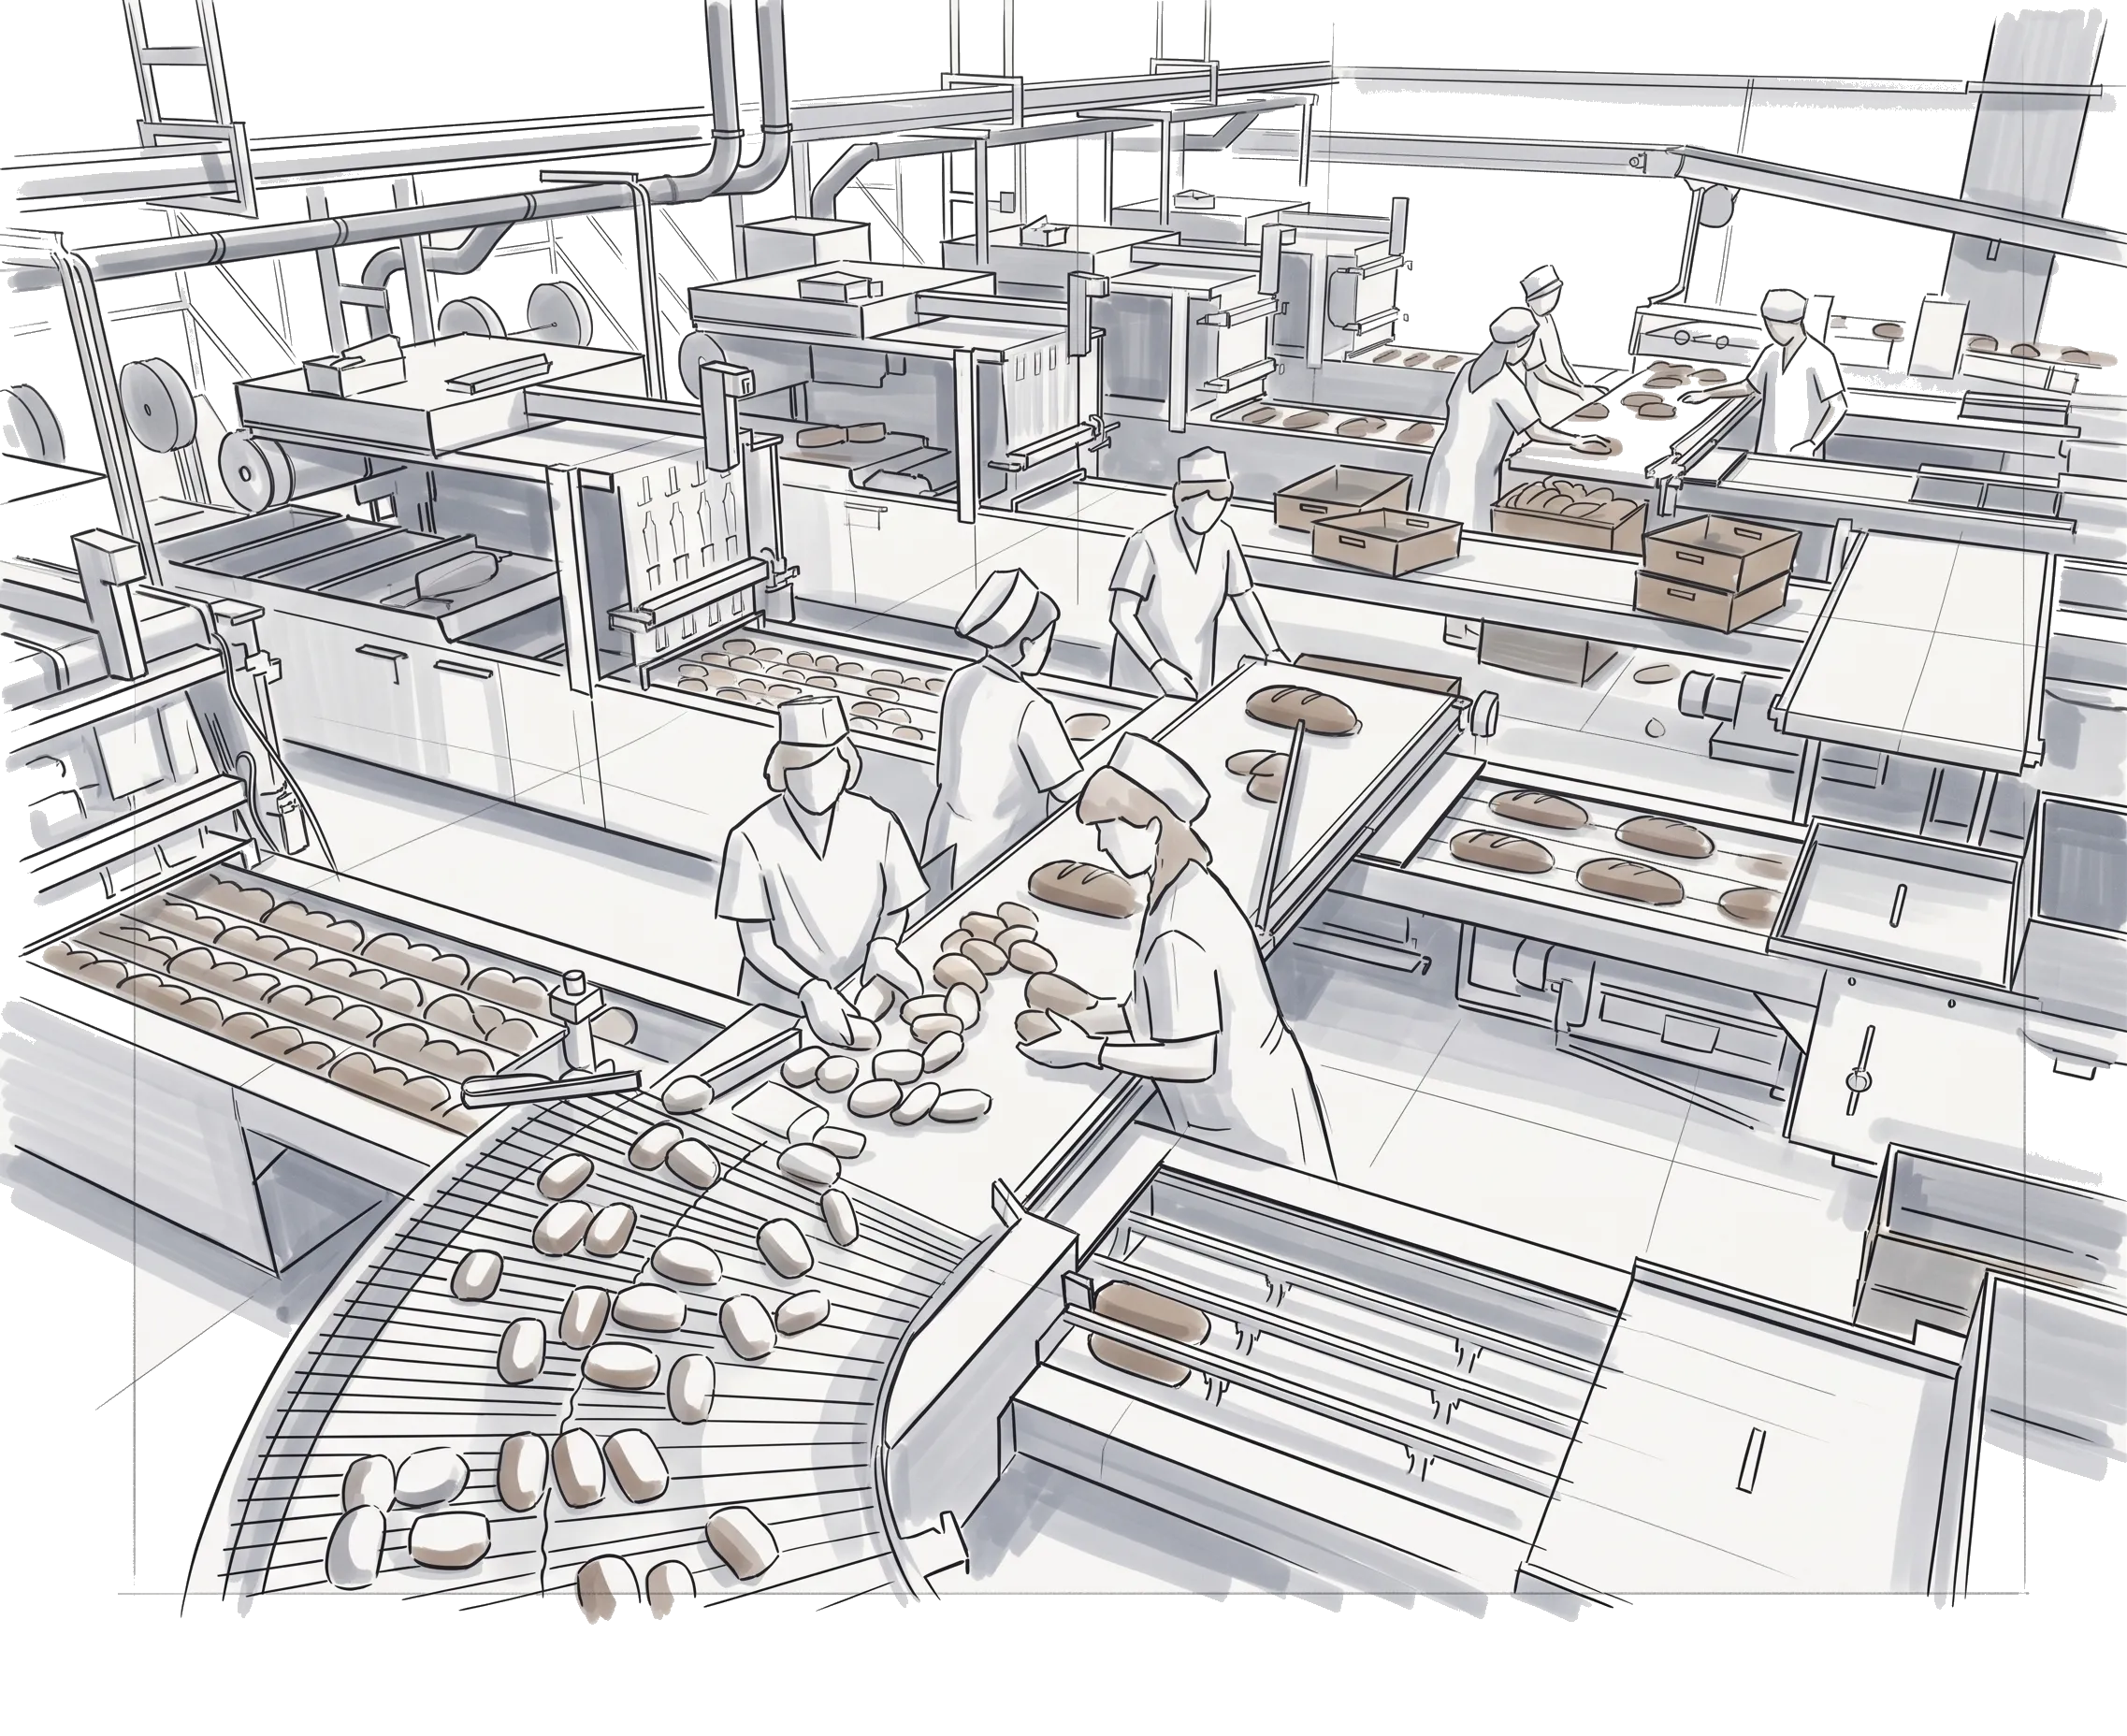
Designing a standardised, scalable product for wildly different factories
Zest had just pivoted from a B2C “wonky veg” service to a B2B food‑waste technology platform, with no established digital product and product–market fit still emerging. Every production line we saw looked completely different – cereals, confectionery, ready meals – raising a key question: how do you design something repeatable when every factory follows a unique process?
Iterating from zero
Drawing on my founder experience to shape 0–1 products
With input from the Zest founders and team, I led the evolution of the “waste map” from a one‑off analysis into a candidate for a scalable digital product. We iterated it with insights from factory staff, ESG officers, quality teams and external experts, testing how it held up in real conversations and decision‑making.
Over countless iterations and working sessions, we explored ways to represent very different production lines using the same underlying structure. The goal was a map that lets manufacturers see, at a glance, where waste appears, how much it is, and where it currently ends up – without needing to understand every nuance of the underlying data model.
Impact & Outcome
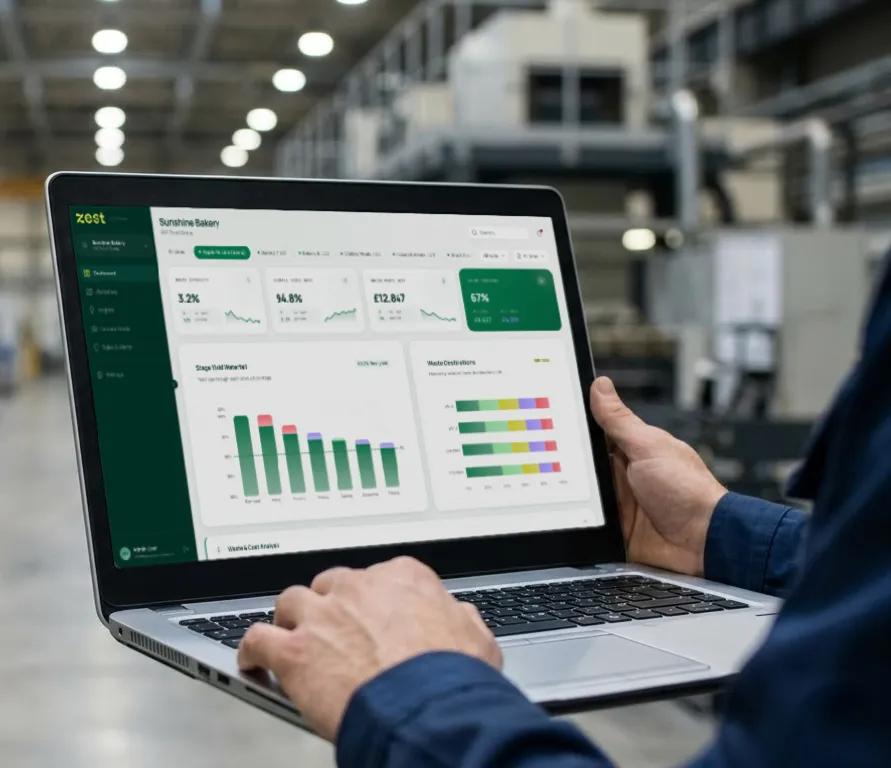
Designing the Waste Map interface
Turning complex factory data into a clear, modular map of where waste happens
I worked with Zest’s data scientists and engineers to turn messy factory data and early schematics into a clean, modular interface that sits inside Zest’s app and scales across very different production lines. Together we defined the core flows, interaction patterns and visual language of the Waste Map, moving from hand‑drawn flow diagrams to wireframes and then to production‑ready UI that makes waste hotspots obvious at a glance, and can be adapted as new factory needs emerge without redesigning the whole experience.
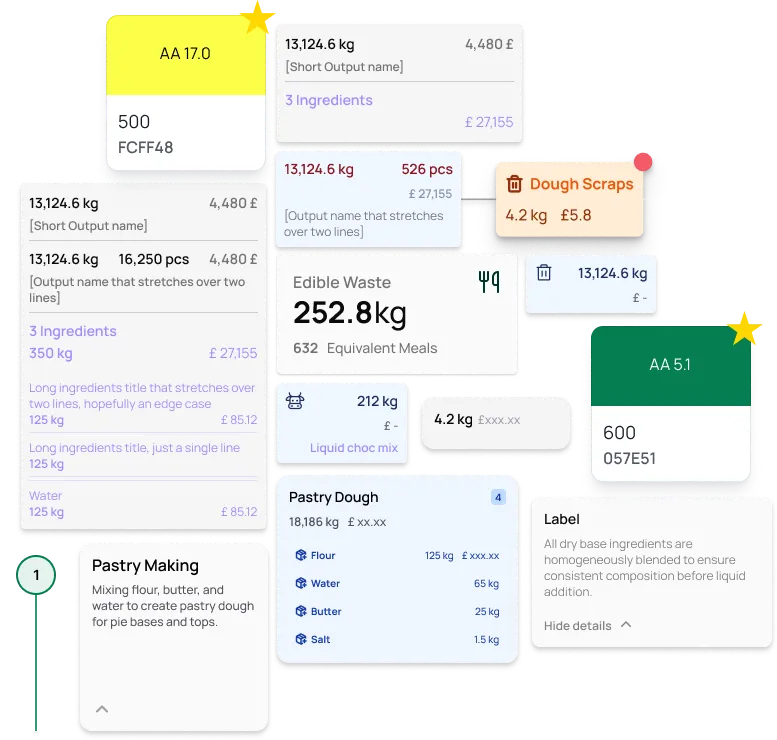
Examples of UI components used in iterations of the Waste Map
Core view for value and impact
The Waste Map is now the backbone of Zest's product and sales story
The Waste Map is becoming the backbone of Zest’s app: the first touchpoint where manufacturers see their own data turned into a clear picture of losses and opportunities. It now anchors sales and pilot conversations, helping prospects quickly see where Zest can have impact and what follow‑on work – alerts, redistribution, wider optimisation – could look like.
Role
Strategic Product Designer
Scope
End‑to‑end product definition and design for the Waste Map: framing the problem, designing flows and interface, and supporting early pilots.
Collaborators
Zest founders, Data Scientist, Full-stack Engineer, Product Manager
Status
In active pilot and rollout with manufacturing customers