Making Wattstor's value visible to the customers paying for it
Redesigning a technical platform so non-technical users could see the ROI, savings, and CO₂ impact that Wattstor was already delivering.
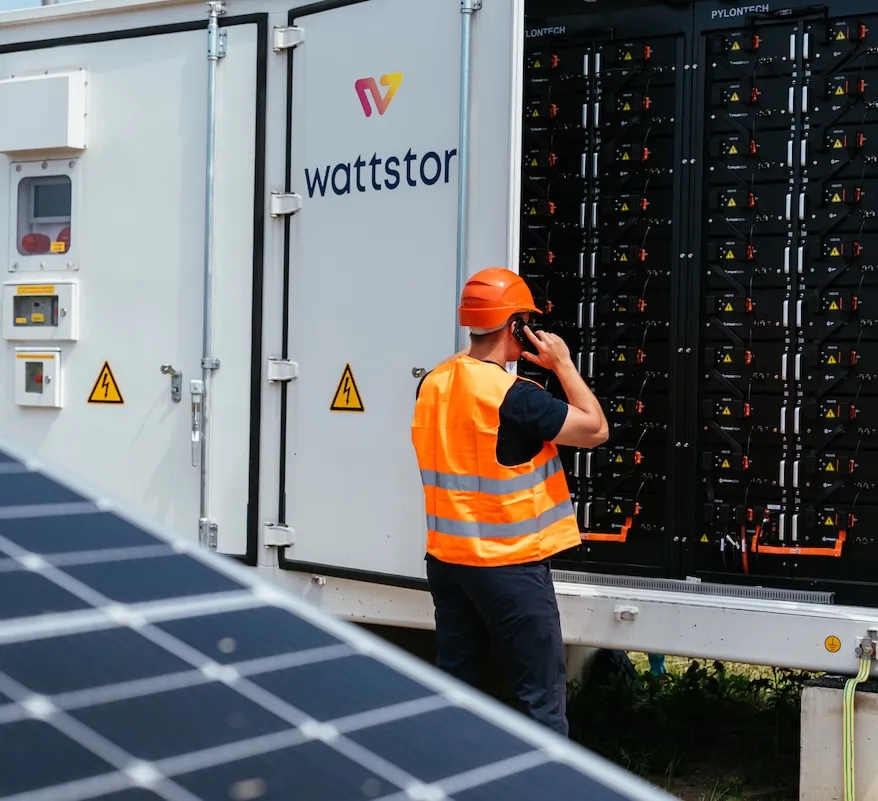
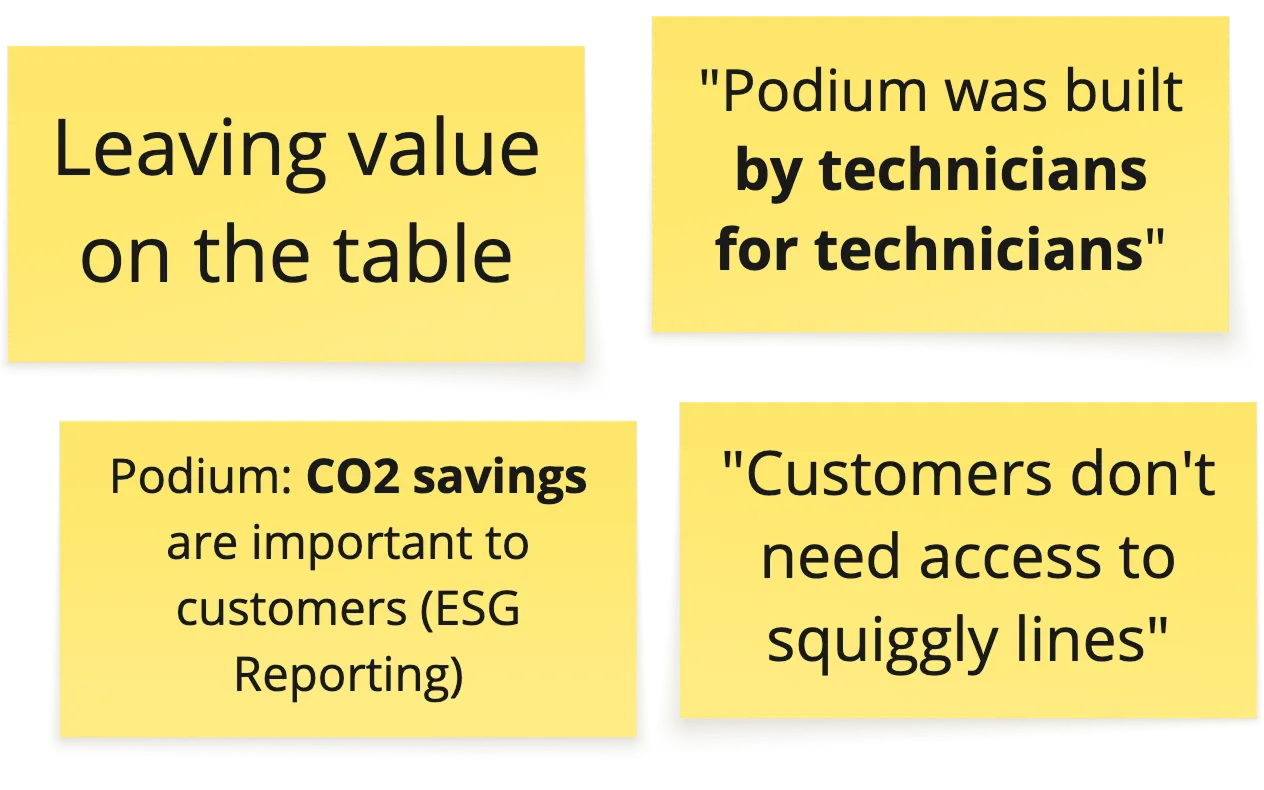
Wattstor designs and operates onsite renewable energy systems for commercial sites, monetising a share of the savings those systems generate. Its Podium platform was focused on the engineering — optimisation, monitoring, fault diagnosis — but it was "built by technicians, for technicians." Site owners, energy managers, and channel partners couldn't see what they were getting for their money: how much they'd saved, how much CO₂ they'd avoided, whether the system was even working.
Challenge
Podium was engineered for technicians, with no summary layer. The metrics that mattered to customers and channel partners were buried in time-series data or absent entirely. Sales couldn't demo Wattstor's value proposition on the platform that delivered it.
Approach
Stakeholder interviews with sales and operations surfaced two distinct user groups and the metrics each needed at a glance. User stories were prioritised, iterated through wireframes and feedback rounds, and validated with engineers on what the underlying data could actually support.
Outcome
A dashboard sales now demos directly in Podium, channel partners scan across their portfolios, and customers use to see exactly what their investment delivered. Live in the Wattstor Podium web app.
Context & Problem
The problem behind the brief
From technical tool to customer platform
Initially, the brief asked for a better-looking dashboard to help sales communicate Wattstor’s value, however, research uncovered a more specific problem:
Podium was built with engineers in mind, surfacing mostly raw technical data. But as Wattstor grew, customers were increasingly asking for savings figures, energy performance, and CO₂ impact, often requiring manual calculations from Wattstor staff.
Leadership was also pushing toward direct end-customer relationships, away from a channel-partner model, and Podium needed to reflect that shift.
The real-time power flow visualisation of the site
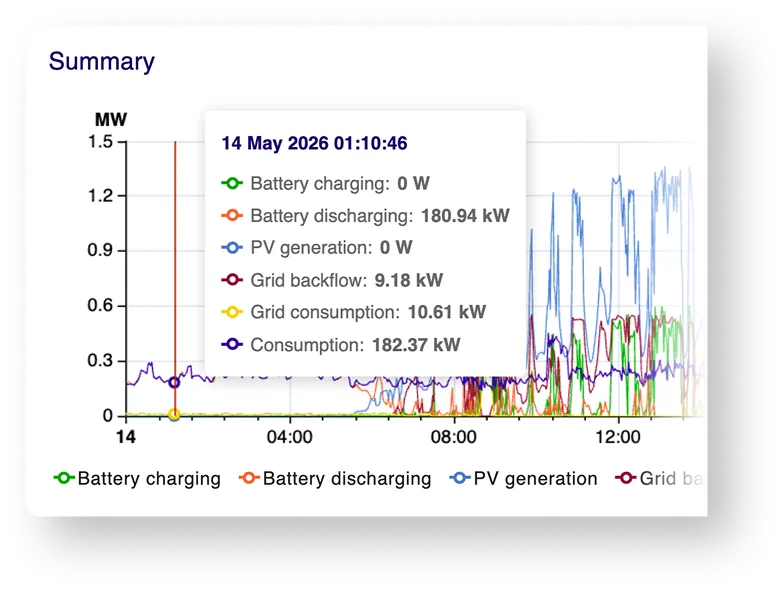
Podium’s data analysis screen helps engineers spot issues
Insights from user research
Approach & Process
Reframing the starting point
From output brief to problem focus
The original brief was solution-first: build a dashboard. But before moving into design, I reframed it as a problem-first question: why couldn’t commercial users access the data that mattered to them, and what would it take to change that. That shift shaped the work that followed.
Miro Board process overview
01
Starting from the commercial gap
The work began by understanding the business problem. Interviews with sales and operations helped clarify what customers needed versus what Podium showed.
02
Translating insights into user needs
Call notes were distilled into insights, then shaped into two personas using a jobs/gains/pains framework. That step produced the specific list of metrics the dashboard had to surface.
03
Mapping needs against what the platform could actually deliver
A data inventory checked what was available in the platform against what users needed. Some things existed, some required new calculations to be built.
Process
Collaborative wireframing
I then drafted multiple wireframes with structured feedback rounds from sales and leadership between versions.
Outcome
Live in Podium
Dashboard UI design
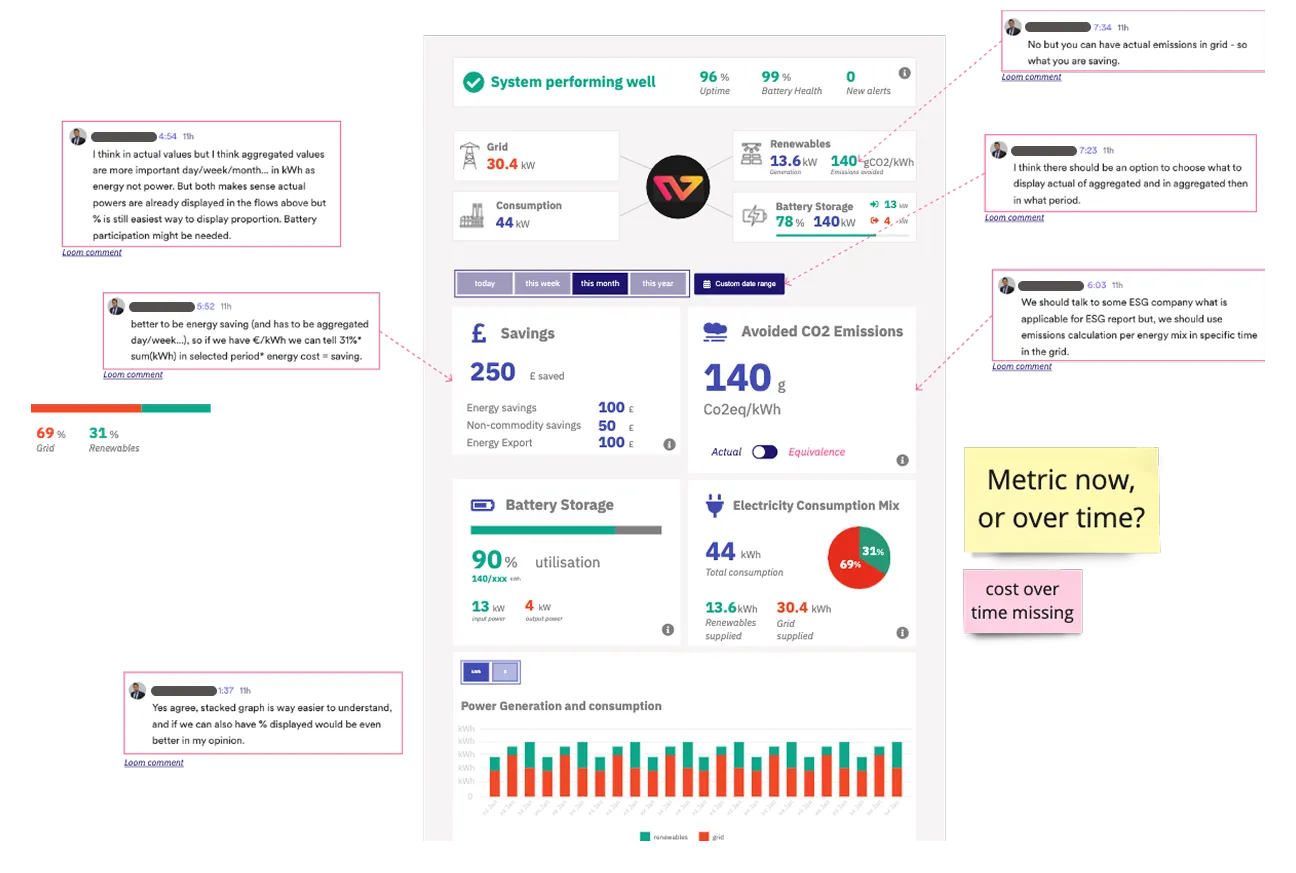
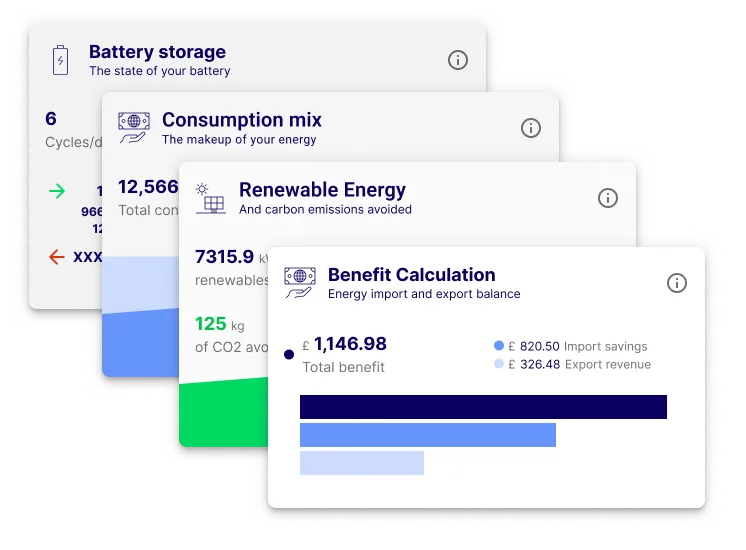
The dashboard gives commercial users a clear read on the four metrics that came up consistently in research: financial savings, renewable energy and CO₂ avoided, battery performance, and consumption mix. Each sits in its own panel with a headline number for quick scanning and a chart underneath for anyone wanting more detail. A shared time selector ties the panels together, so the whole view shifts between yesterday, last week, last month, or a custom range in one step.
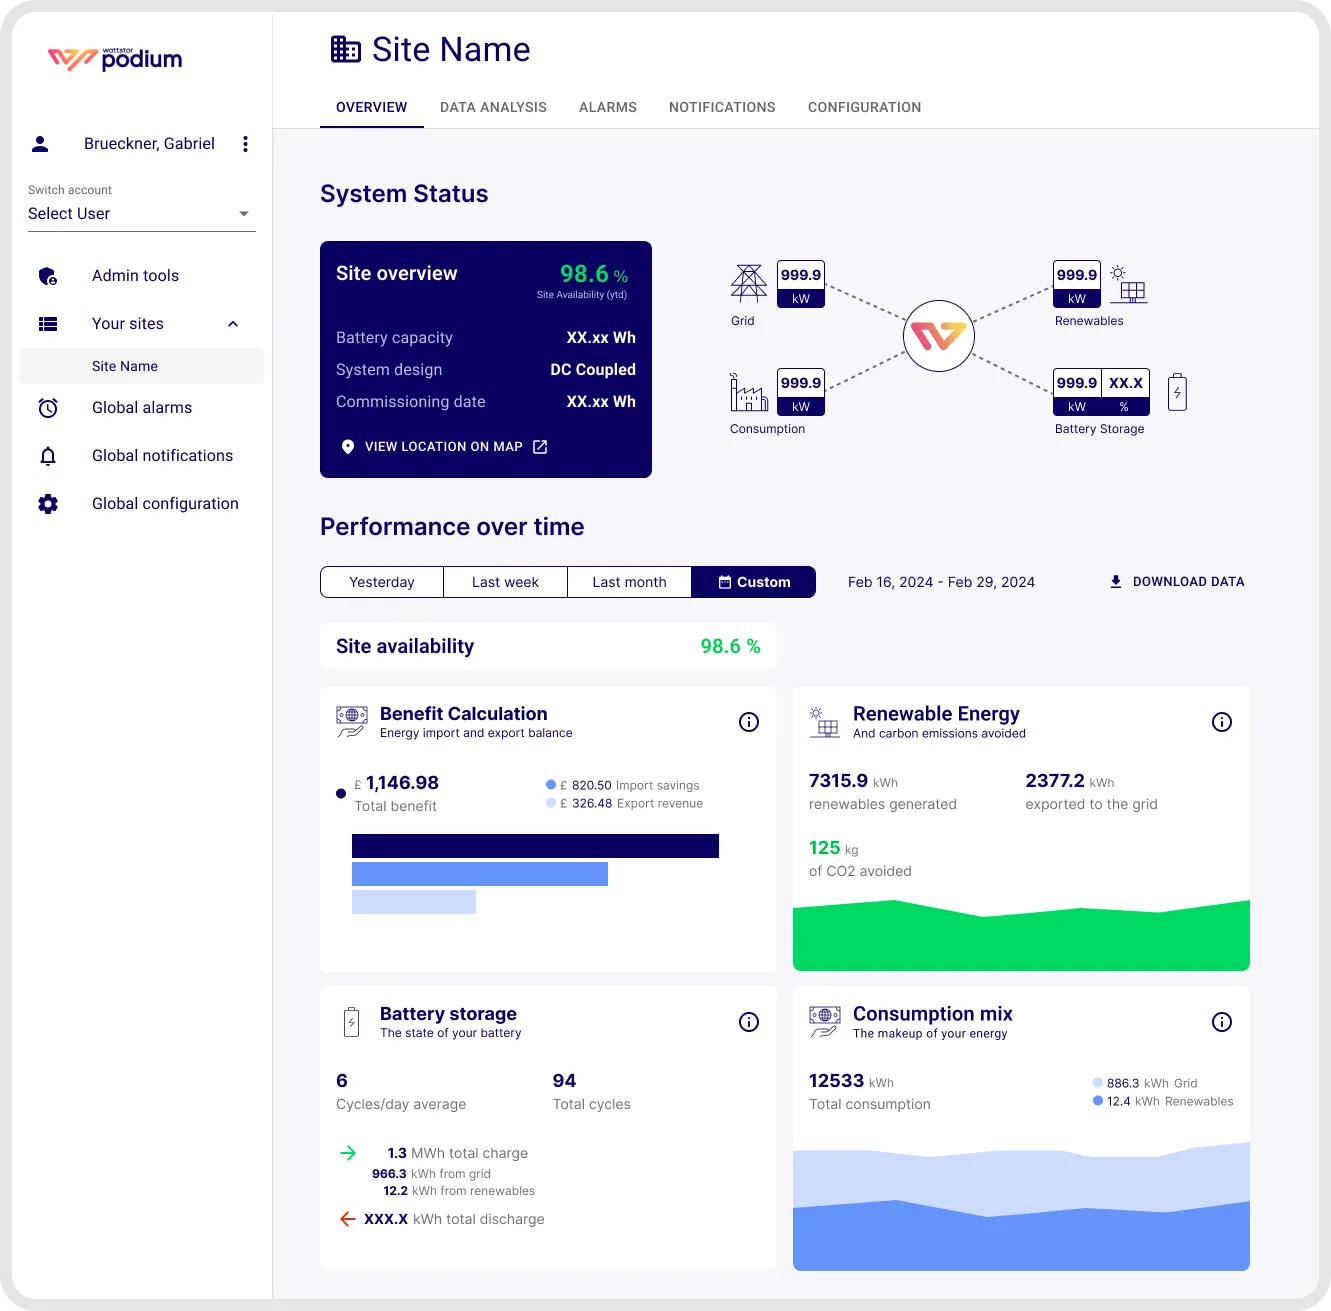
Modular design, adaptable use
The modular layout meant panels could be built and iterated independently, and extended as new data became available. The result is a single screen that works for a site owner checking their return on investment and a channel partner checking system health — without needing separate views for each.
Role
Lead Product Designer
Scope
Research, wireframing, UI design, user testing
Collaborators
Head of Product, Engineering team
Status
Live feature — Wattstor Podium web app